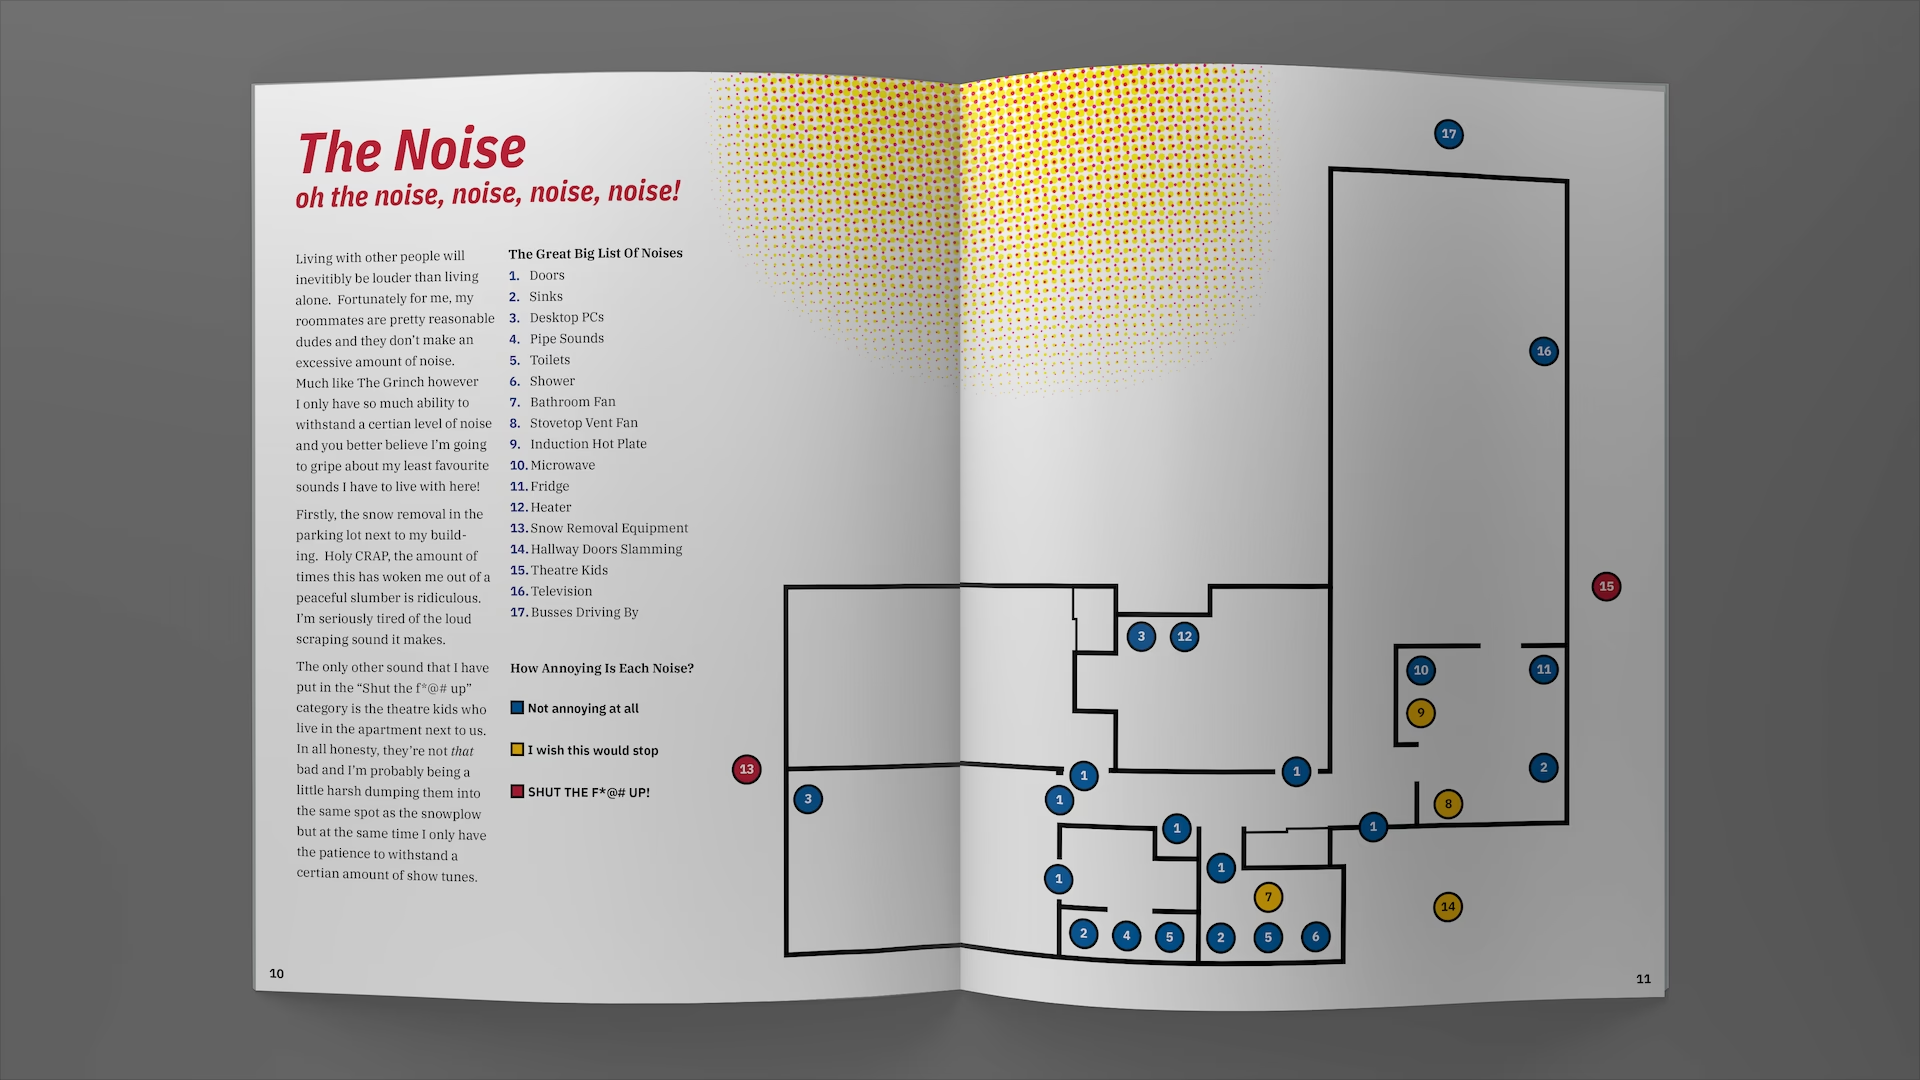
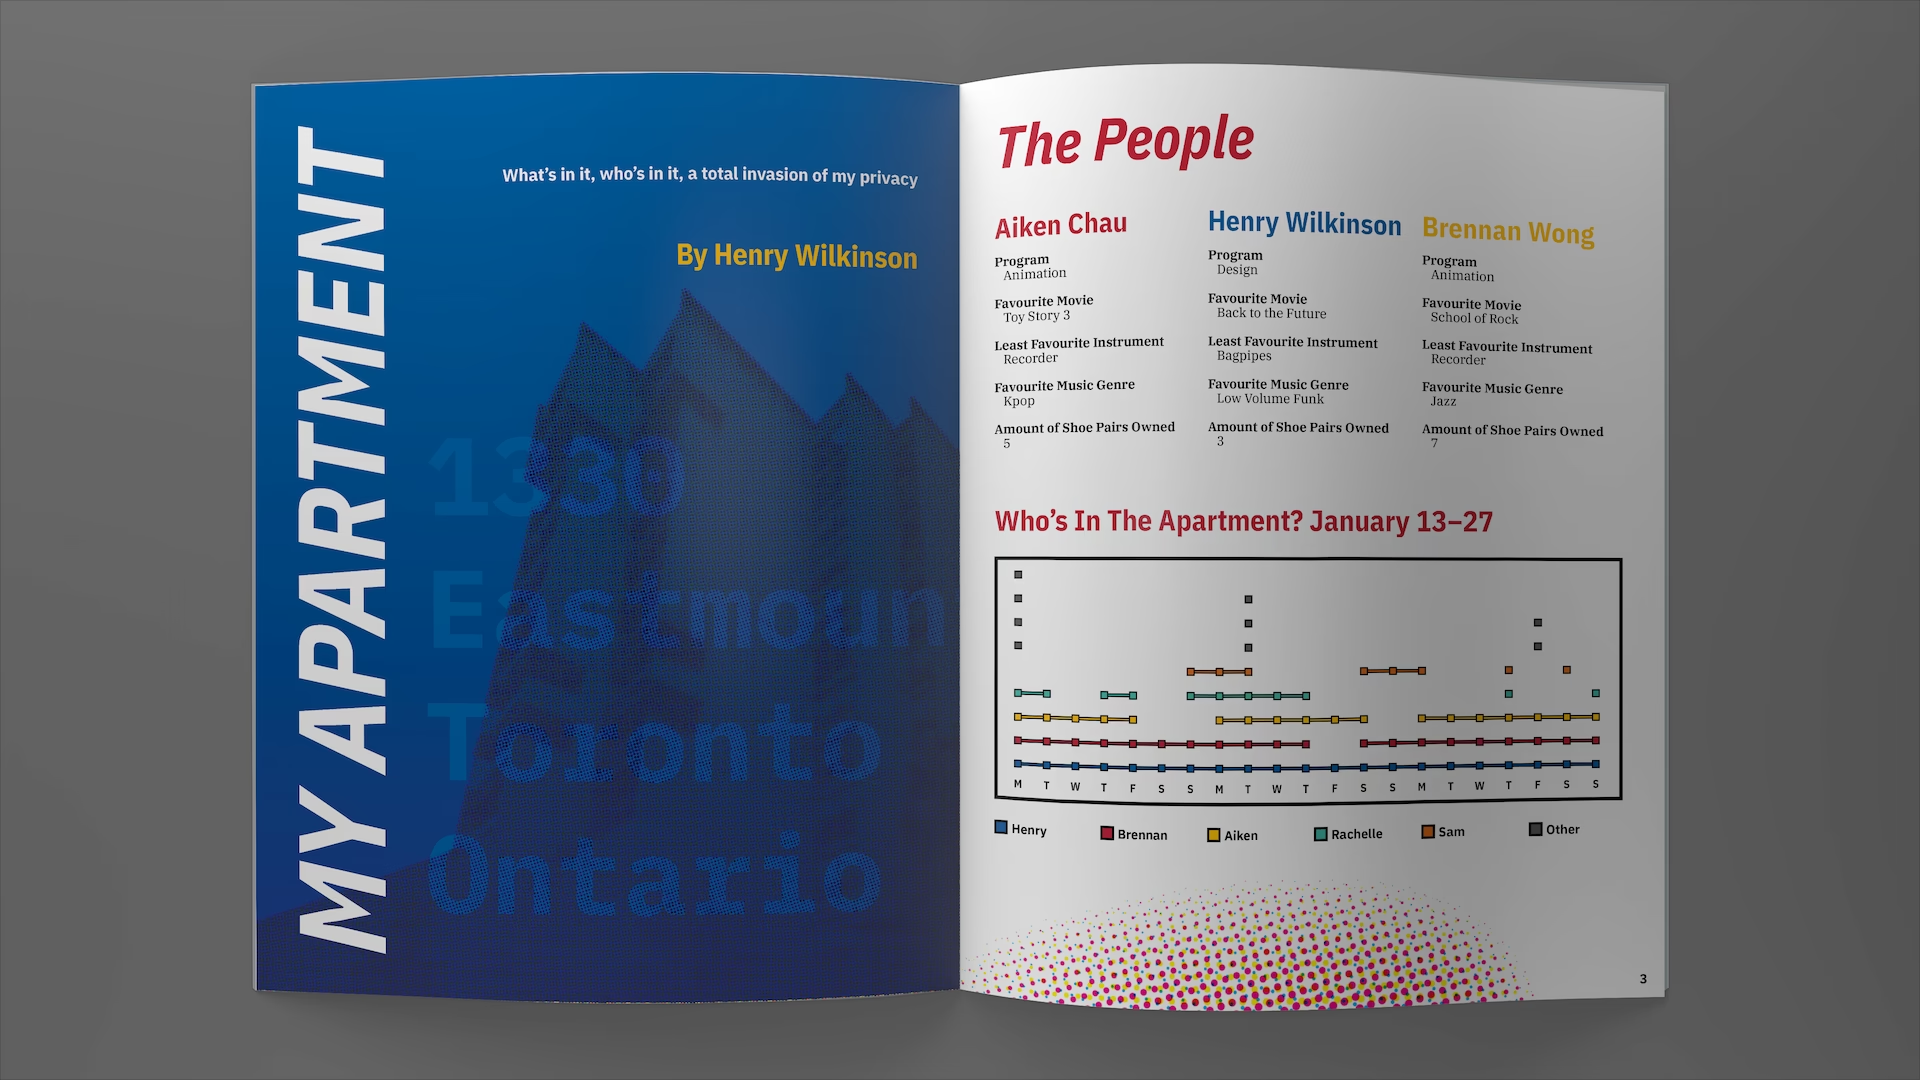
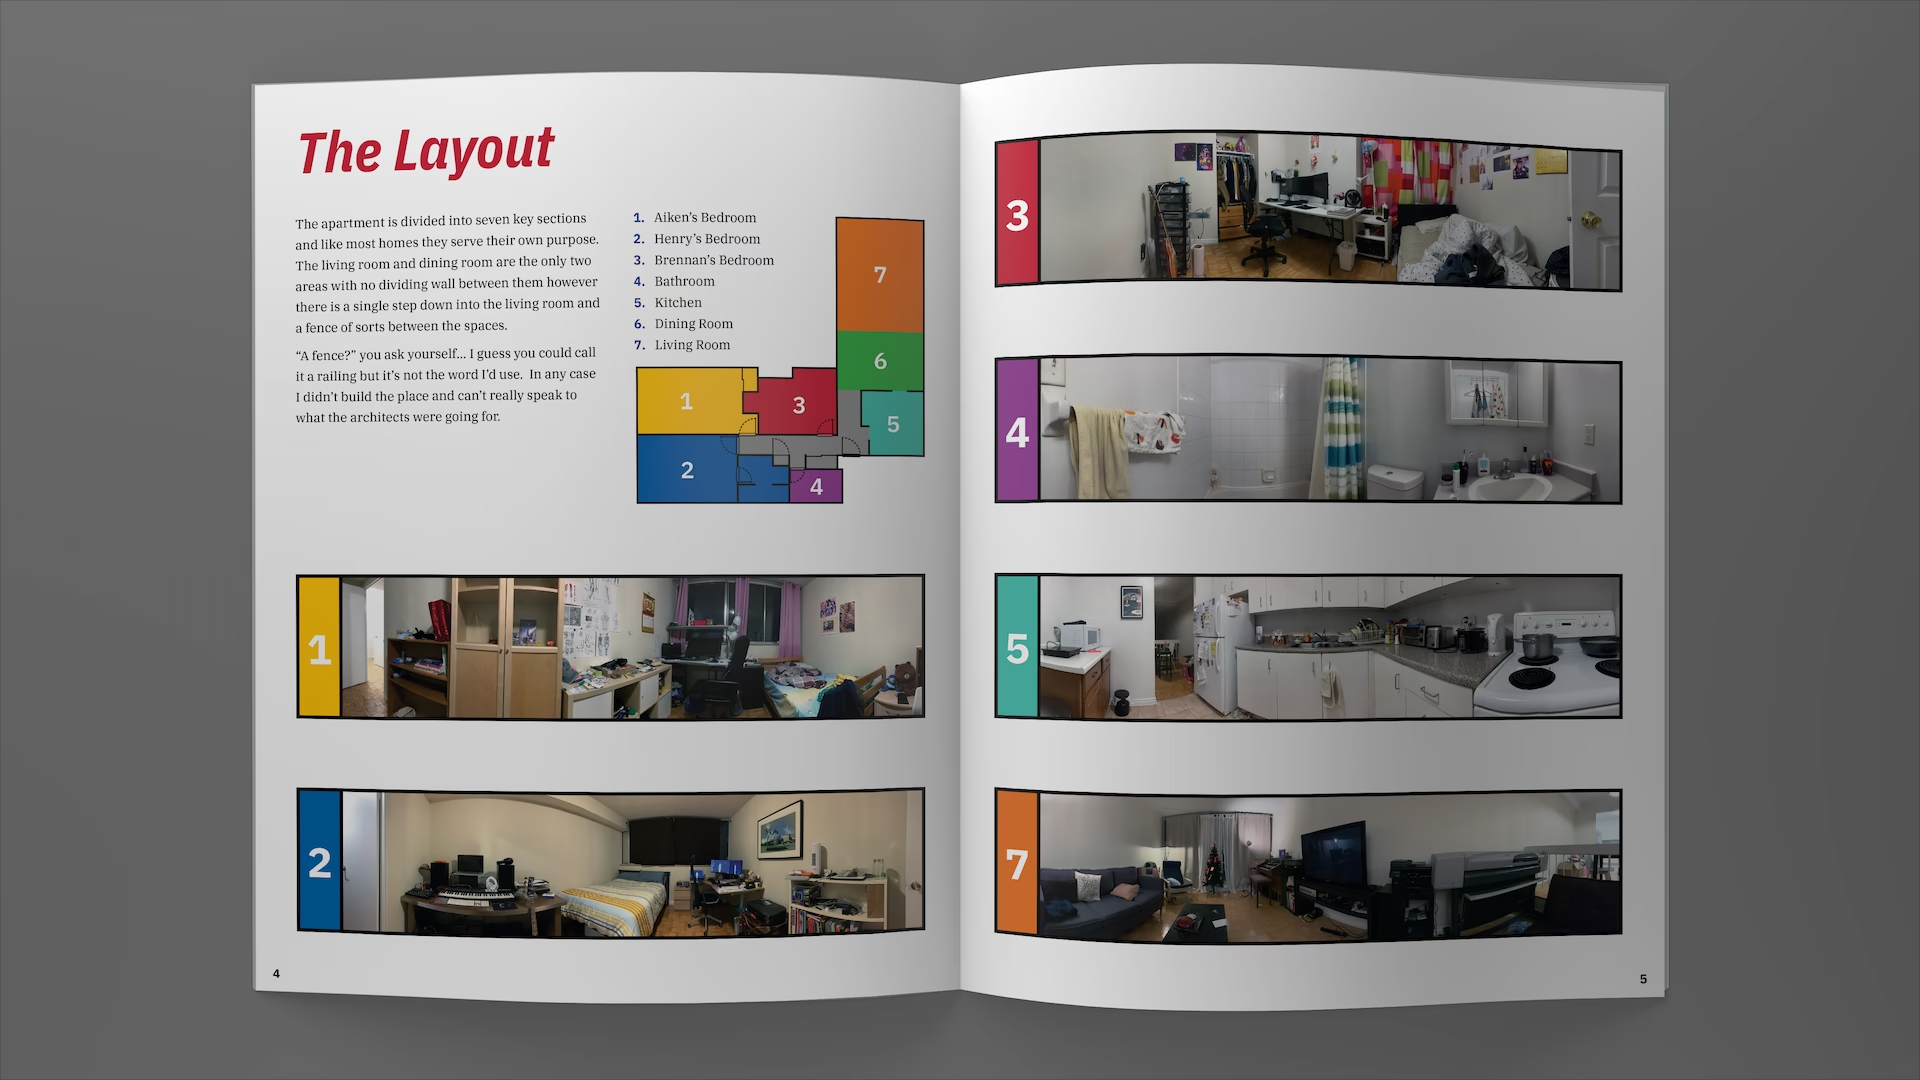
We spend a lot of time our own spaces but how often do we really take inventory of them? For this project I created a series of data-visualizations that cover different aspects of my university apartment.
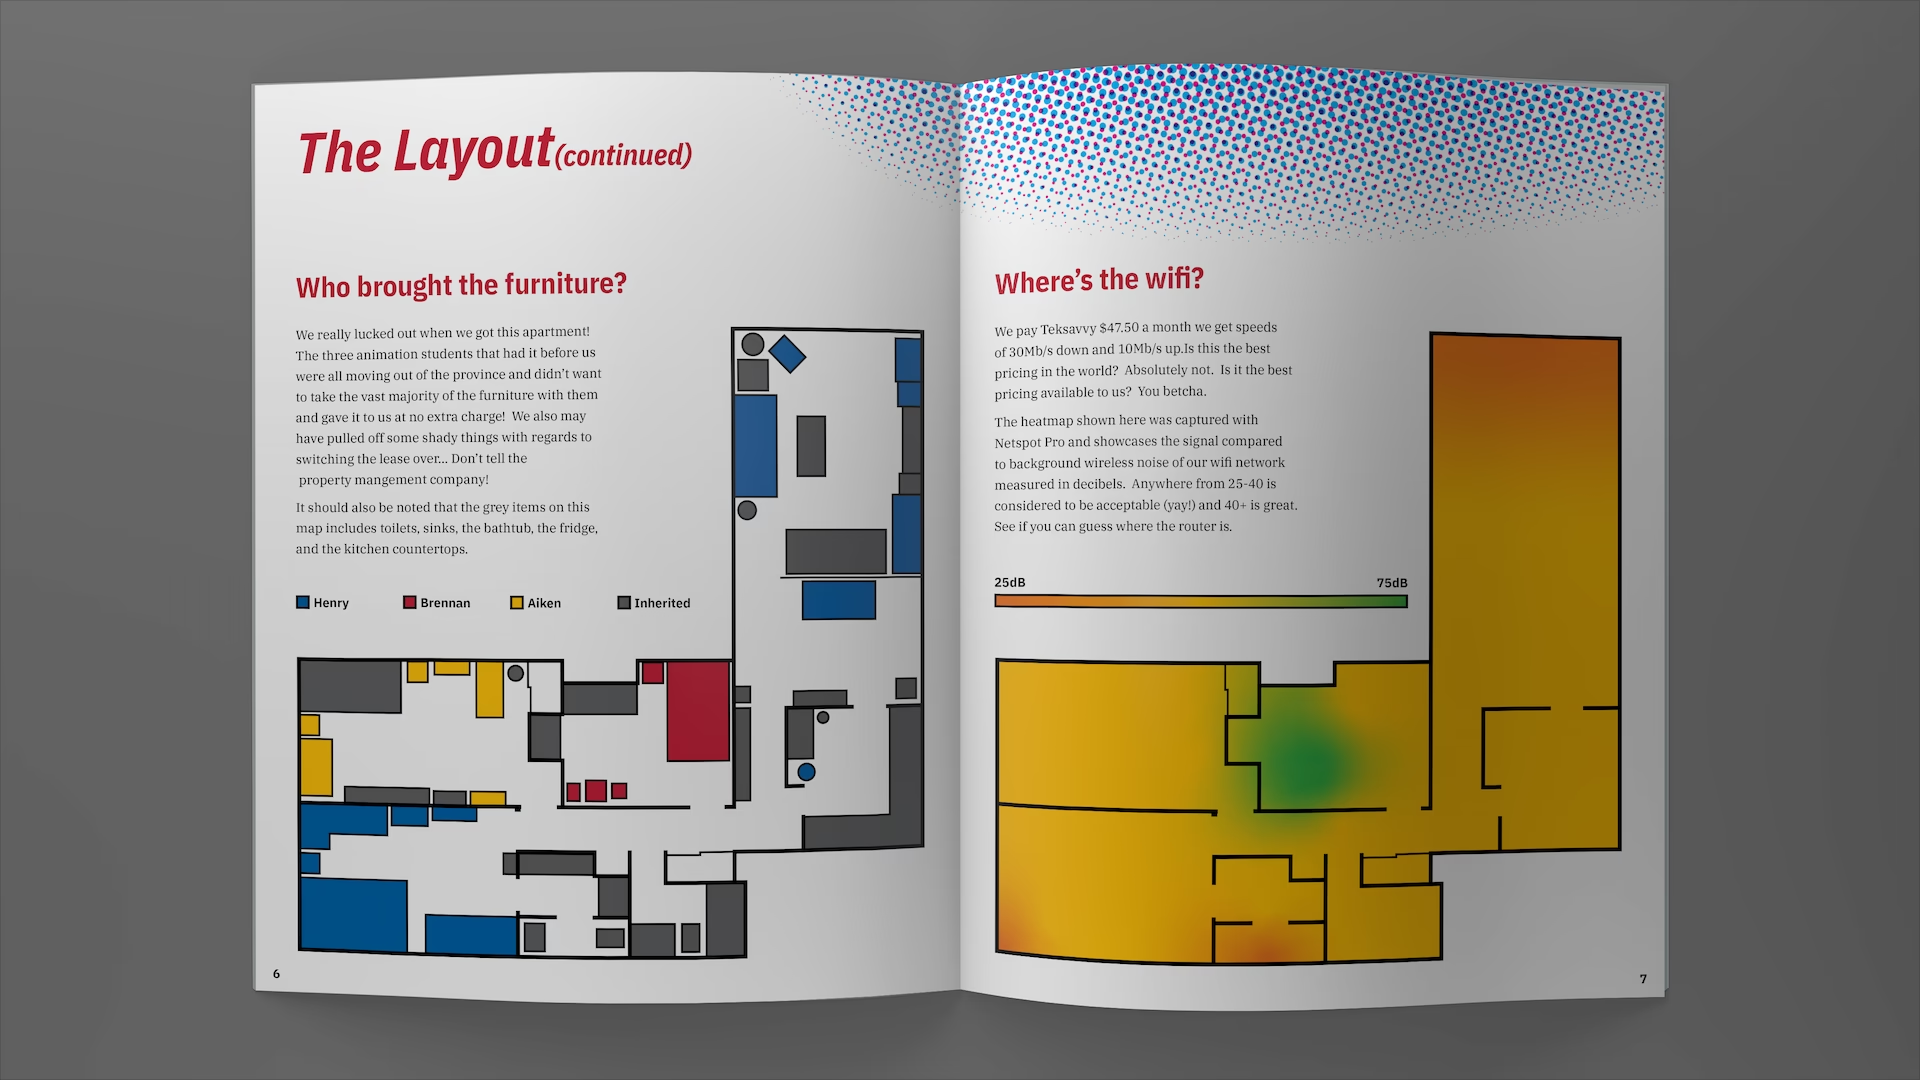
I mapped my wifi network by loading the apartment floor plan into Netspot and taking measurements at key locations for every room until a full coverage map could be created. Unfortunately I don’t have a good system for loading Netspot’s data into a program that lets me apply styles as needed. This coverage map was made manually in Illustrator with freeform gradients according to the values on Netspot’s original heat-map output.
